Where the stops sit in Bitcoin right now
Last price 81980.55 · candle of Mon 19 Oct 00:00 UTC
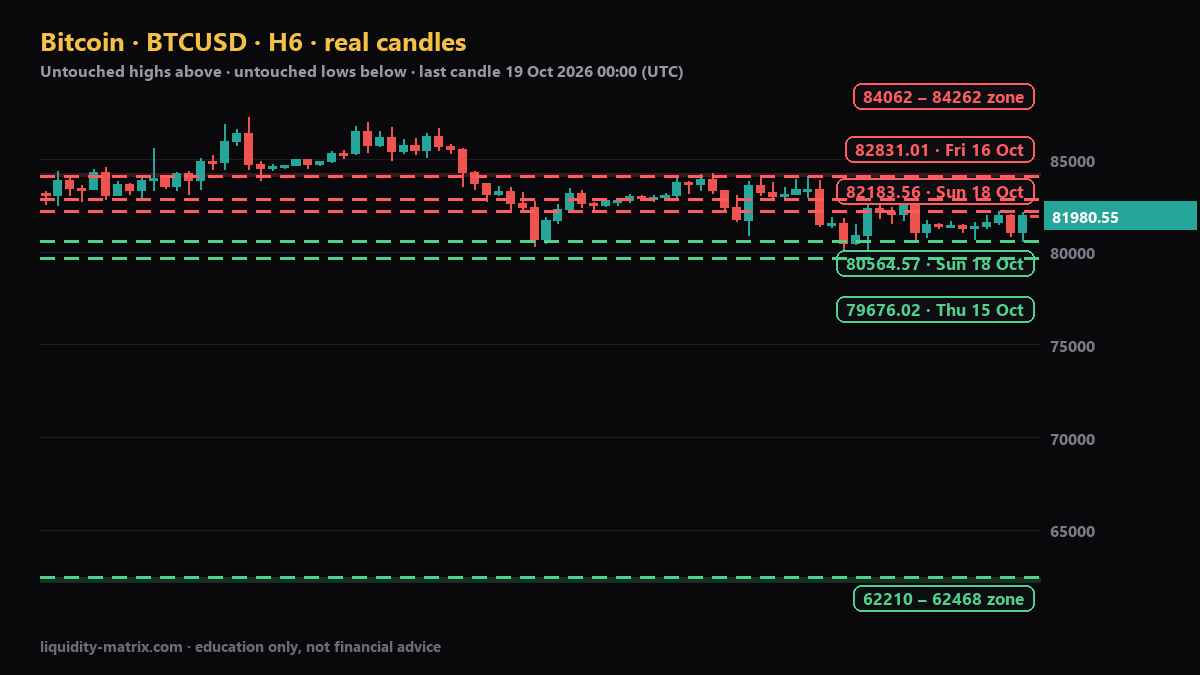
Highs above and lows below the last price that have not been traded through since they formed. Stops usually rest just beyond them. Found by code on real candles (Coinbase public data).
| Side | Level | Formed | Why it matters |
|---|---|---|---|
| Above | 82183.56 | Sun 18 Oct | Sunday's high, not traded through yet: the nearest pool of buy stops. |
| Above | 82831.01 | Fri 16 Oct | A swing high from Fri 16 Oct, not traded through since. |
| Above | 84062 – 84262 | 12 Oct · 13 Oct · 14 Oct | Price reached this zone 3 times and no candle closed above 84261.99. Buy stops sit above it. |
| Below | 80564.57 | Sun 18 Oct | Sunday's low, not traded through yet: the nearest pool of sell stops. |
| Below | 79676.02 | Thu 15 Oct | A swing low from Thu 15 Oct, not traded through since. |
| Below | 62210 – 62468 | 31 Jul · 1 Aug · 3 Aug · 14 Aug | Price reached this zone 4 times and no candle closed below 62209.81. Sell stops sit below it. |
Two scenarios to watch — not a prediction
Sweep above
Price runs up to 82183.56, then 82831.01, then 84062 – 84262. Watch whether it closes back below (a sweep that fails to hold) or keeps closing above (a breakout that has to be respected).
Sweep below
Price runs down to 80564.57, then 79676.02, then 62210 – 62468. Watch whether it closes back above (stops taken, buyers return) or keeps closing below (the move continues).
Sessions: Asia · London · New York
Each session's high and low is a pool of stops. Which ones were already taken, and did price reject them (closed back inside) or accept them (held beyond)? Now: Asia.
| Session | High | What happened | Low | What happened |
|---|---|---|---|---|
| Sat Asia 00:00–07:00 UTC | 81561.76 | taken Sat 07:30 UTC by London · rejected (closed back inside) | 81271.80 | taken Sat 15:45 UTC by New York · rejected (closed back inside) |
| Sat London 07:00–12:00 UTC | 81655.47 | taken Sun 01:30 UTC by Asia · rejected (closed back inside) | 81424.01 | taken Sat 12:15 UTC by New York · rejected (closed back inside) |
| Sat New York 12:00–21:00 UTC | 81573.15 | taken Sat 21:00 UTC by off-session · rejected (closed back inside) | 81072.79 | taken Sat 21:15 UTC by off-session · accepted (held beyond) |
| Yesterday Asia 00:00–07:00 UTC | 81969.84 | taken Sun 09:30 UTC by London · rejected (closed back inside) | 81262.62 | taken Sun 13:30 UTC by New York · accepted (held beyond) |
| Yesterday London 07:00–12:00 UTC | 82183.56 | untouched — stops still there | 81502.46 | taken Sun 13:15 UTC by New York · accepted (held beyond) |
| Yesterday New York 12:00–21:00 UTC | 82015.03 | taken Sun 23:15 UTC by off-session · accepted (held beyond) | 80564.57 | untouched — stops still there |
- Nearest resting buy-side liquidity: Yesterday London high 82183.56.
- Nearest resting sell-side liquidity: Yesterday New York low 80564.57.
- Recent history (14 days): London took Asia's high 71% and low 21% of days; New York took London's high 36% and low 79%.