Stop being the liquidity.
See where it sits.
Liquidity Matrix shows where stops collect on real gold charts — equal highs and lows, sweeps, ranges and the levels price keeps refusing — so you understand the move before you're caught in it.
Where the stops sit right now
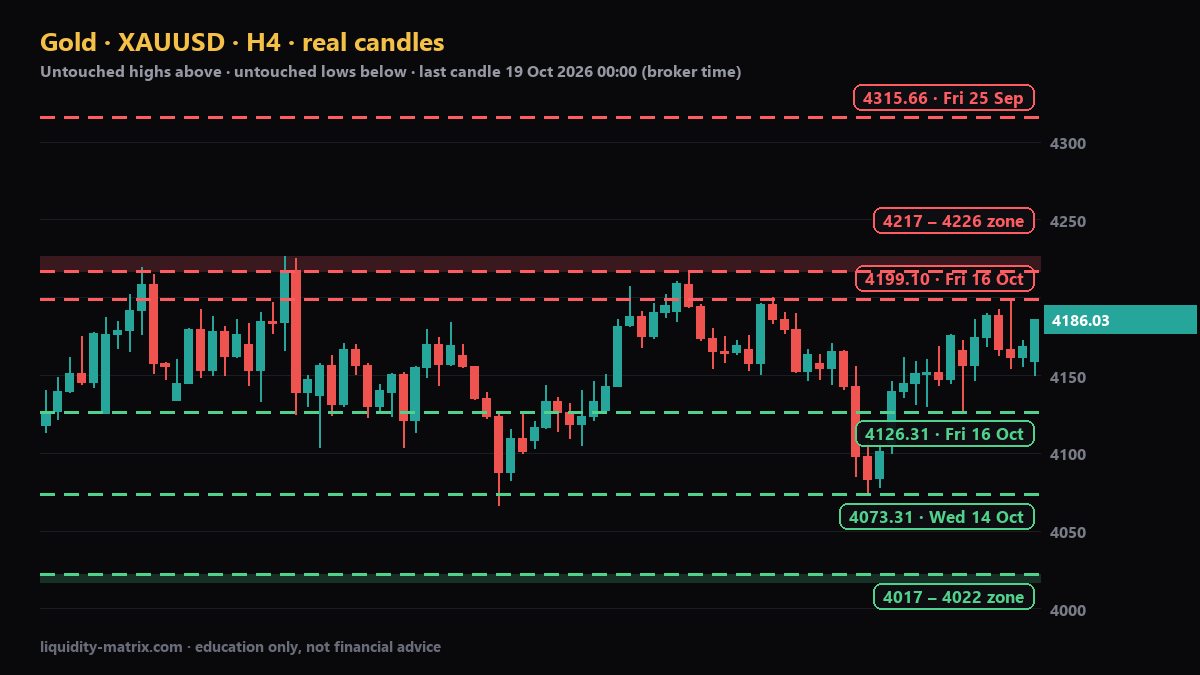
Every day we map the highs and lows price has not traded through yet. Stops rest beyond them, and that is where the next sweep usually comes from. The levels are found by code on real MetaTrader candles — nothing is drawn by hand.
Three things we look for on every chart
Pools of stops
Equal highs, equal lows and clean swing points: the places where many traders put their stop loss — and where price is drawn to.
Sweeps and walls
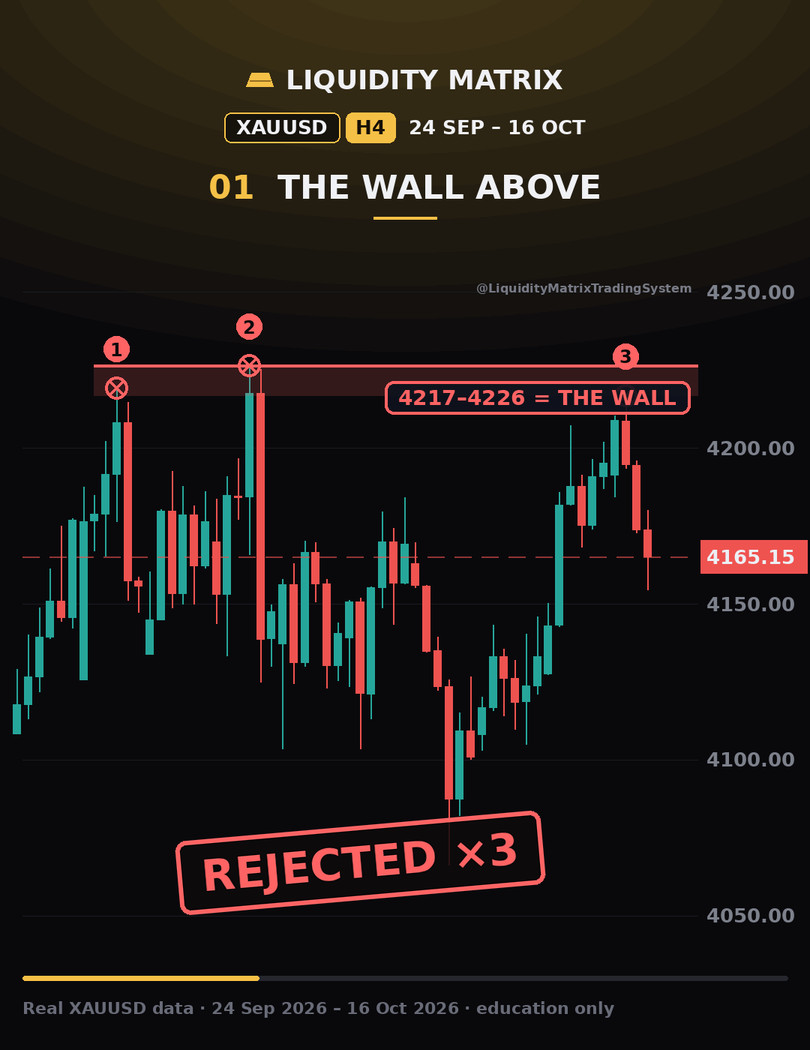
A wick through a level that closes back inside, or a zone price hits again and again without closing through. We show what happened next — including when it failed.
Ranges and breaks
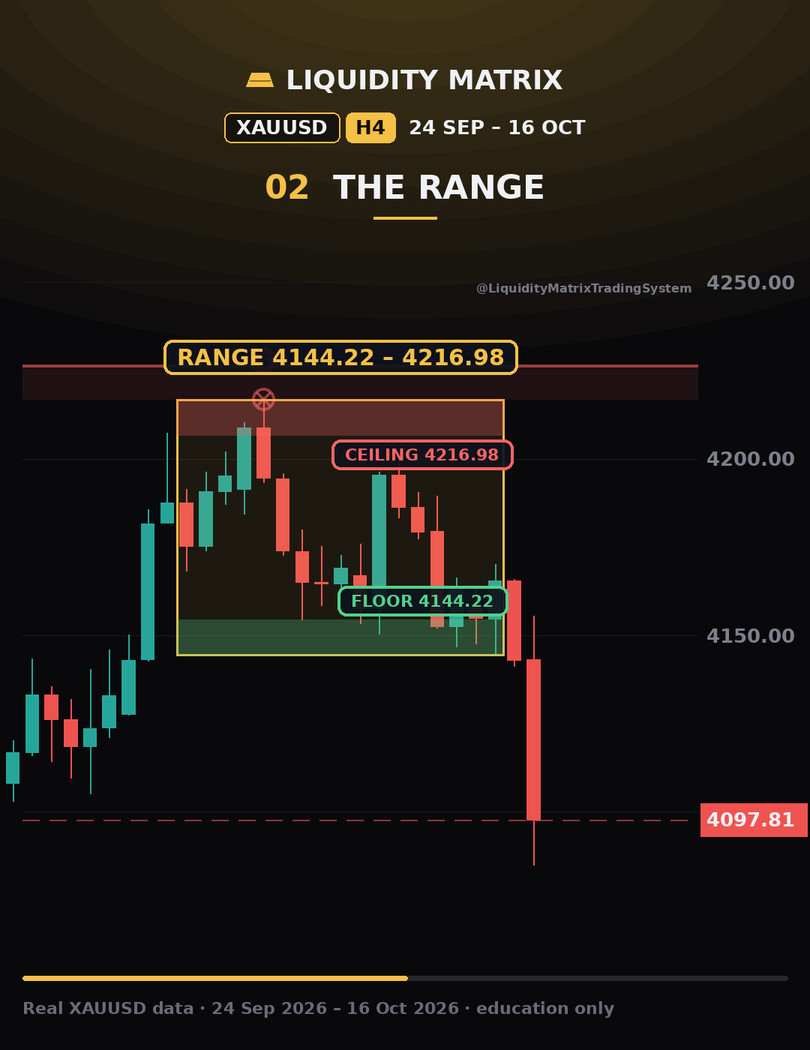
Where price compresses, where the ceiling and floor are, and whether the break really followed through on the candles after it.
Real-chart replays, bar by bar
Our Shorts replay the real candles. The chart draws each level as the story reaches it, and the result is read from what price actually did afterwards.
- Real MetaTrader data with the dates on screen
- Levels found by code, never drawn after the fact
- Failed setups shown as clearly as the ones that worked